How to Compare Two Stocks in the Same Sector
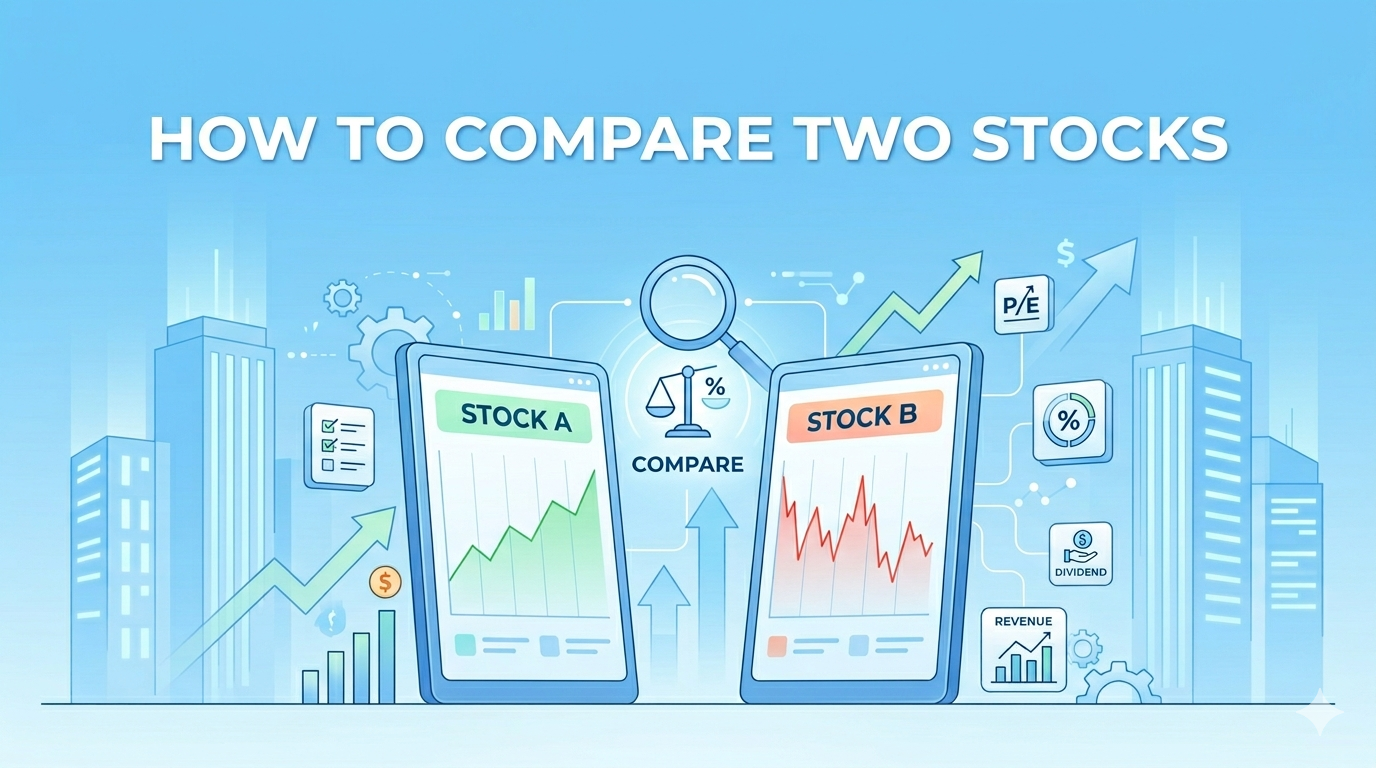
You see two electric car companies. One trades at 80 times earnings, the other at 12. The cheaper one must be the bargain, right? Not quite. Price alone tells you nothing—what matters is whether the business behind that price tag justifies the premium or discount the market is handing it.
Comparing competitors is not about picking a winner—it's about building a repeatable framework that lets you measure profitability, growth, and valuation side by side.
When you compare two stocks in the same sector, you're asking one question: why does the market price these two similar businesses differently, and does that difference make sense? To answer it, you need a process—one you can reuse every time you're weighing two competitors.
Start with what they actually earn
Revenue is what a company brings in. Profit is what it keeps. Two companies can generate the same revenue and have wildly different bottom lines, so start with profitability.
Look at net profit margin—net income divided by revenue. This tells you how much of every dollar in sales turns into profit. A company with a 15% margin keeps 15 cents on every dollar. A competitor with a 5% margin keeps a nickel. That gap often explains why one stock commands a higher valuation.
Compare margins over the past three years. If one company's margin is expanding while the other's is shrinking, that's a signal about efficiency, pricing power, or cost control—and it matters more than a single quarter's number.
Then measure how fast they're growing
A slow-growing company priced like a rocket ship is a red flag. A fast-growing company priced like a utility might be overlooked.
Check year-over-year revenue growth and earnings growth for both companies. You want to see whether growth is accelerating, steady, or stalling. A company growing revenue at 30% annually will almost always trade at a higher multiple than one growing at 3%—and it should.
But don't stop there. Compare how much each company is spending to generate that growth. If one is burning cash to buy market share while the other is growing profitably, the market will price that difference in.
Finally, stack up what you're paying
Now you know what each company earns and how fast it's growing. The last step is figuring out what the market is charging you for that performance.
Use the price-to-earnings ratio (P/E)—stock price divided by earnings per share. If Company A trades at a P/E of 25 and Company B at 40, you're paying 40 dollars for every dollar of Company B's earnings versus 25 for Company A. That premium might be justified if Company B is growing twice as fast or has stronger margins. If it's not, the valuation gap is a warning sign.
For companies that don't have profits yet, compare price-to-sales ratios instead. This tells you what you're paying per dollar of revenue. It's less precise, but it works when earnings are negative or inconsistent.
What this won't tell you
This framework gives you a financial snapshot—it doesn't capture competitive moats, management quality, or looming regulatory risk. A company can have beautiful margins and still be on the wrong side of a technology shift. Another might have a low P/E because the market sees trouble ahead that the numbers haven't reflected yet.
Comparing stocks is not about finding the "better" company. It's about understanding why the market prices them the way it does, and deciding whether you agree. The numbers give you the starting point. Everything else is context.
This article is for educational purposes only and does not constitute financial advice. Always do your own research before making any investment decisions.
Want to put this into practice? Our article on how to read a company's earnings report walks you through where to find the numbers that power this framework.