P/E Ratio: What It Means and How to Use It Correctly

A high P/E might signal overvaluation, or it might reflect justified optimism about a company's growth prospects — you cannot tell from the number alone.
You see it plastered across stock screeners, financial news tickers, and investor forums — the P/E ratio. But here's the catch: a low P/E doesn't always mean a bargain, and a high one doesn't always mean overpriced. Without context, this single number can lure you straight into a value trap or convince you to overpay for hype.
What you're actually measuring
The P/E ratio — or price-to-earnings ratio — tells you how much investors are paying for each dollar of a company's profit. Calculate it by dividing the stock price by earnings per share.
Two versions exist: trailing P/E uses the last 12 months of actual earnings, while forward P/E uses analyst estimates for the next year. Historically, the average trailing P/E for the market has hovered around 16.2. As of April 2026, it sits at 24.8 — meaning investors are paying significantly more per dollar of earnings than the long-term norm.
Why context changes everything
There's no universal "good" P/E ratio. What matters is the sector and the growth story behind it.
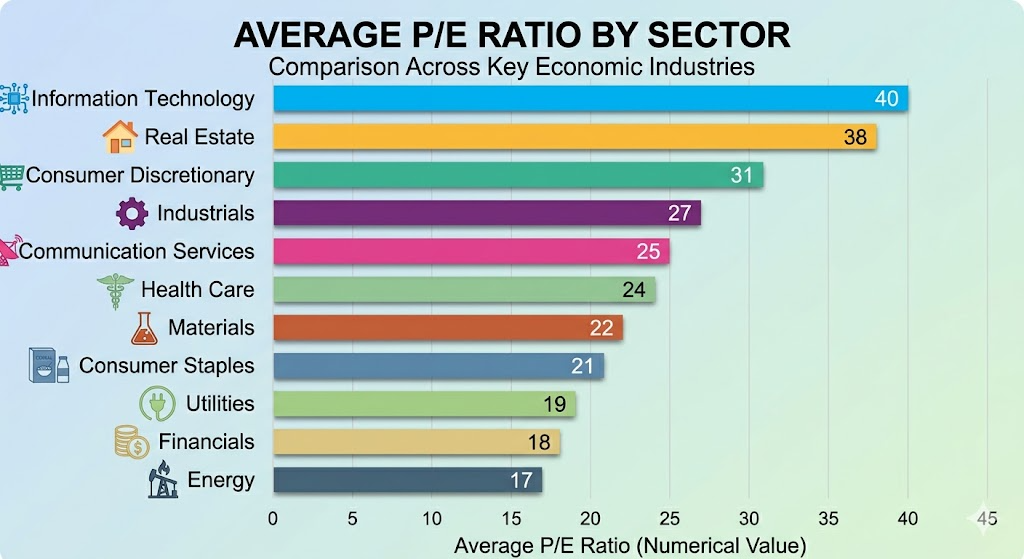
Information Technology commands the highest P/E ratios — hovering around 40 to 41 — because investors expect strong future earnings growth from software and cloud companies. Meanwhile, Energy and Financials remain among the cheapest sectors, often trading well below the market average.
A tech company with a P/E of 35? That might be reasonable. A utility company with the same ratio? Red flag.
The trap that fools even experienced investors
During periods of market stress, the P/E ratio can become deeply misleading. In the 2008-2009 financial crisis, the P/E ratio surged into triple digits — not because stocks got wildly expensive, but because earnings collapsed faster than prices.
If you had relied on P/E alone, you would have seen sky-high ratios and assumed everything was overvalued, missing some of the best buying opportunities in decades.
To avoid this trap: use P/E alongside the PEG ratio (which factors in growth), compare it to industry benchmarks, and always check the quality of the earnings behind the number.
💡The PEG shortcut
Divide the P/E ratio by the company's expected growth rate. A PEG under 1 often suggests the stock is undervalued relative to its growth — a PEG above 2 may signal it's overpriced.
📌The bottom line
The P/E ratio is a useful starting point, but it's never the full story. Always compare it to sector norms, growth expectations, and the broader economic picture before drawing any conclusions.
This article is for educational purposes only and does not constitute financial advice. Always do your own research before making any investment decisions.
Want to go deeper? Explore our Financial Education articles for more.